IoT clinical data accessible to researchers, healthcare professionals, and participants
Managing clinical data from IoT devices presents specific challenges in terms of integration, organization, and visualization. MiceLab, a research group of the Institut d’Informàtica i Aplicacions at the University of Girona, needed a mobile solution capable of structuring the information collected during its diabetes studies and making it easily accessible to researchers, healthcare professionals, and patients.
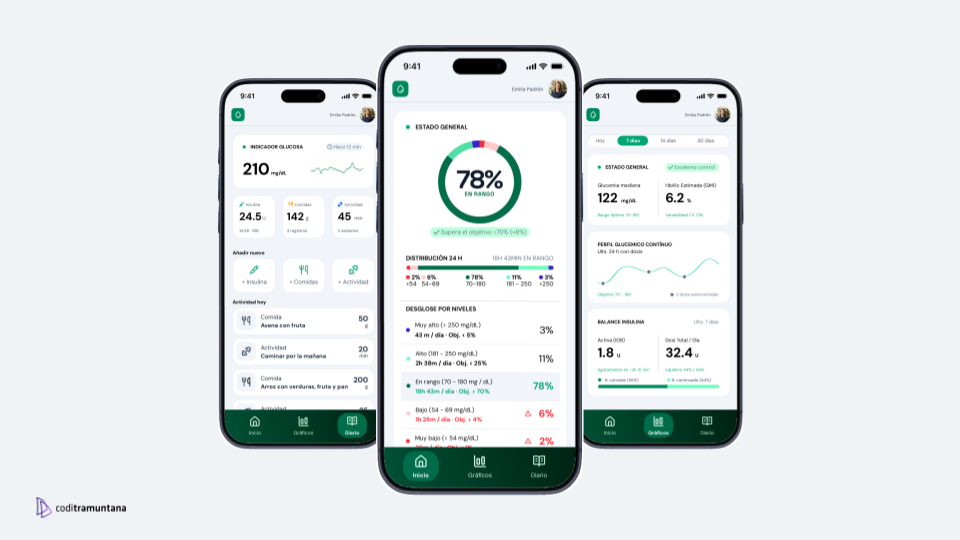
To address this need, we developed an Android application based on Kotlin Multiplatform. The solution enables real-time visualization of clinical information, organizes data by study, and maintains a smooth user experience even when displaying large volumes of records.
Project Information
Client
MiceLab – Institut d'Informàtica i Aplicacions (University of Girona).
Industry
Healthcare Research.
Service
Custom Software Development.
Core Technologies
Kotlin Multiplatform, Jetpack Compose, Ktor, IoT.
Objective
Visualize and manage clinical data collected from IoT devices used in diabetes research studies.
The Challenge: Turning Clinical Data into Actionable Information
MiceLab uses third-party IoT devices in its diabetes studies, integrating them with mobile devices to collect data or validate its algorithms in clinical trials. However, it needed a specific tool to query, organize, and analyze the information generated during the various studies.
The research team needed a solution that would allow information to be structured by clinical trial, properly categorize the records associated with each patient, and facilitate access to the data for researchers and healthcare professionals, as well as for clinical trial participants.
From a technical perspective, the project also involved two significant challenges: integrating with a highly complex API and displaying large volumes of information on mobile devices while maintaining a smooth and consistent user experience. As a result, the ability to efficiently interpret and access data became one of the key elements of the project.
The Solution: A Multiplatform Application for Accessing Clinical Data
To address the project’s requirements, an MVP (Minimum Viable Product) approach was adopted, with the goal of delivering an initial functional version that would validate the data access and visualization model while allowing the solution to evolve progressively. Although the initial scope focused on developing an Android application, the architecture was built using Kotlin Multiplatform, establishing a technological foundation ready for future compilation and expansion to iOS.
The application was designed as a central access point for information generated by IoT devices, making it easier to access and organize data collected throughout the different studies. The solution’s structure needed to accommodate both research requirements and the data access needs of healthcare professionals and patients.
From the earliest stages of development, data visualization and the organization of information by study were defined as key elements of the user experience. This approach enabled the creation of a tool capable of managing clinical information in a structured manner and facilitating its interpretation across different usage scenarios.
Architecture and Technologies Used
The solution was developed using an architecture based on Kotlin Multiplatform (KMP), a technology that provided a solid foundation and prepared the product for future evolution. This approach facilitated the organization of business logic and helped maintain a consistent architecture throughout the development process.
Jetpack Compose was used for the presentation layer, enabling the creation of dynamic interfaces focused on accessing clinical information while optimizing the display of large volumes of data on mobile devices.
Integration with external systems was implemented using Ktor, which acted as the communication layer with the API. This component was key to managing the retrieval of the information required for each study.
Core Technologies
- Kotlin
- Kotlin Multiplatform (KMP)
- Jetpack Compose
- Ktor
- Processing and visualization of data from IoT devices
- Real-Time Data Updates
Performance and Visualization: The Main Technical Challenges
One of the project's biggest challenges was ensuring smooth visualization of large volumes of clinical data on mobile devices.
The application needed to display information from multiple studies, continuously update data, and provide a consistent user experience while navigating between charts and visualizations. This scenario required special attention to both interface performance and the efficient handling of information received from external systems.
Optimizing the visualization layer became a key aspect of the development process. The goal was not only to display the data, but to do so in a way that allowed researchers, healthcare professionals, and patients to interpret it easily, without the volume of information negatively affecting the application's usability.
As a result, the solution is capable of simultaneously displaying five charts containing hundreds of records while maintaining a smooth user experience, even during navigation between visualizations and the continuous real-time updating of information.
Results Achieved
The project provided MiceLab with a mobile platform designed to access and visualize clinical information from IoT devices in a structured and real-time manner.
Key outcomes include:
- Stable integration with external systems.
- Centralized access to information generated across different studies.
- Structured data access organized by clinical trials and patients.
- Automatic data updates as new records are generated.
- Simultaneous display of five charts with hundreds of data points while maintaining a smooth user experience.
- A technological foundation ready to support new features and future research studies.
Do You Need to Turn Complex Data into Useful Tools for Your Users?
One of the key lessons from the project was the importance of defining from the outset how data will be consumed and visualized.
In applications that rely on graphical data representation, the structure of the information directly impacts performance, interpretability, and the overall user experience. For this reason, it is essential to establish early on how data will be organized and presented to ensure it can be easily understood by different user groups.
The project also reinforced the need to address chart optimization from the earliest stages of development. Maintaining smooth navigation while simultaneously displaying multiple charts containing hundreds of records requires specific technical decisions in both data management and the visualization layer.
Do You Need to Turn Complex Data into Useful Tools for Your Users?
Integrating sensors and connected devices is only part of the challenge. For data to deliver real value, it must be organized, processed, and presented in a way that makes it easy to access, understand, and act upon.
At Coditramuntana, we develop mobile applications, data platforms, and IoT solutions tailored to the specific needs of each organization, combining robust architecture, high performance, and an excellent user experience.
Do you have a project related to data visualization, IoT, or custom software development?